AEX analysis

Last time I wrote on the AEX as follows:

To conclude I can say that on a longer term basis it looks like that the AEX can continue its rise to 480pts (the 76.4% Fibonacci correction level or 560pts (the previous top of 2007). However, if the breakthrough of the longterm descending trendline and 61.8% Fibonacci trendline in the monthly chart appears to be false, which can not be disregarded looking at the weekly- and dailychart, a fall to 340-280 is still possible.

Today we have the following situation: The AEX indeed continued its rise towards the 76.4% Fibonacci retracement level around 480 points. Until today the high is 466 points but I expect more to come.

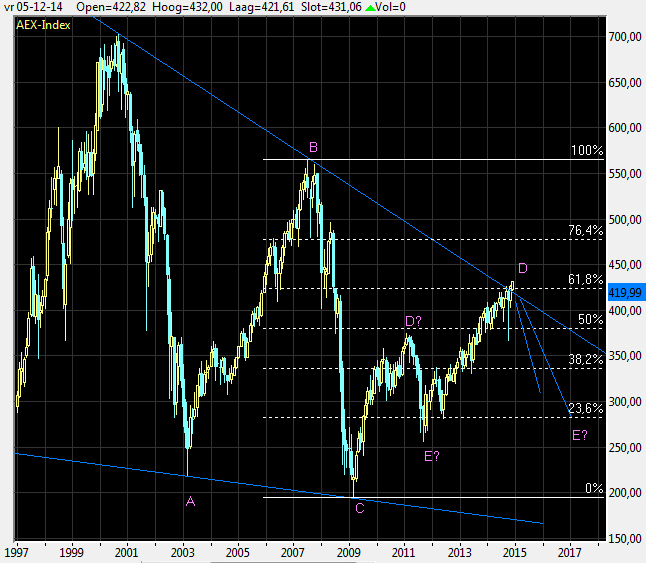
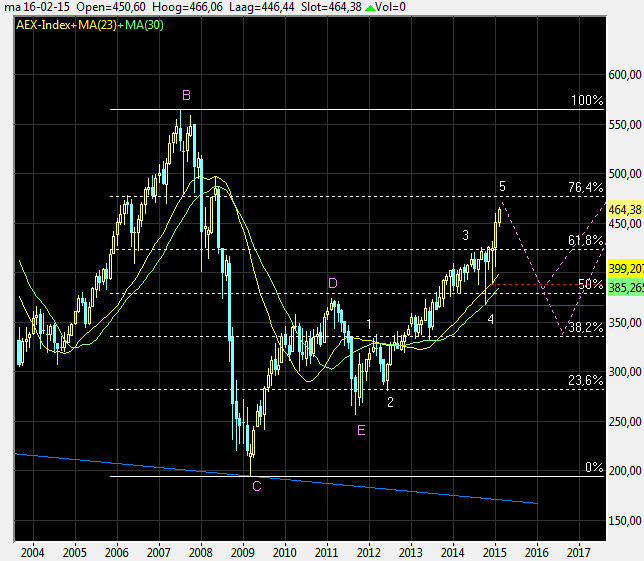
Looking at the monthly chart below I see that the AEX has left the correction triangle and that D and E have been set in resp. March and September 2011. This means that a period of impulse rising has started since then. By the way, this does not mean that there will not occur some serious corrections along the way. I think that when current impulse towards 480 has ended, a correction of 38.2/61.8% (based on the rise as from September 2011) is possible. That could bring the AEX to roughly 390-340 points. These Fibonacci levels will be brought in by me as soon as a top on current impulse wave has been set.

aexmaand150216


Weekly chart:

aexweek150216

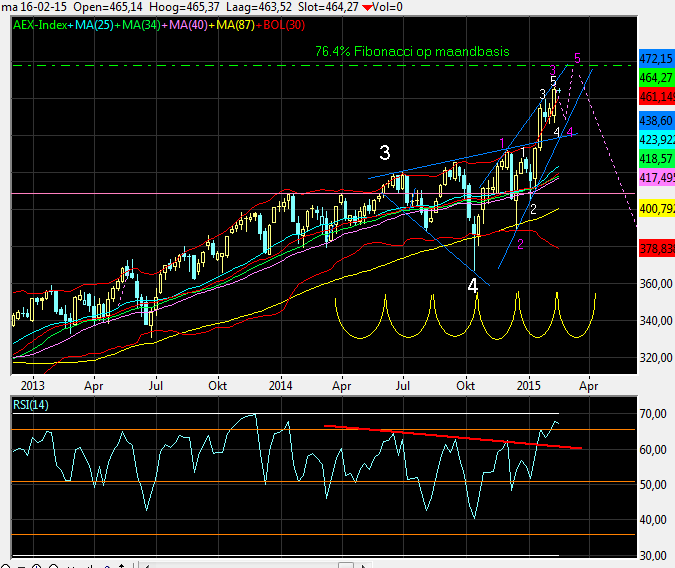
Looking at the weekly chart I see that the end of wave 5 current impulse wave should be coming close. The trend-channel towards 5 around 76.4% Fibonacci level on monthly basis is slowly narrowing. If my counting is right yet another correction towards 450-445 could happen followed by a last rise heading for the forementioned 480 level. After that the correction to 390-340 as mentioned above should be in the pipeline.

DAX analysis

Last time I wrote as follows:

When this support fails coming weeks and the level of the top of wave I (9460) is touched, a longer term top has been set already. But if the wave V of 5 has yet to come, the end year rally may continue as from today up to 10300-10500 range.

Today the DAX shows following:

DAXweek150126

The move from early October to end November can be counted as impulse wave I. After finishing correction wave II early January, impulse wave III is now on the way. The shape of this last wave V of 5 still needs the be formed and is therefore uncertain. Nice is to see how the red trendline on the RSI has been re-tested during correction wave II.  As target I see the DAX reaching the level of 11000 before starting a bigger correction towards 8000-6500 range based on Fibonacci retracement levels on the impulse wave started September 2011.

DAXweek150126b